
 |
||

|
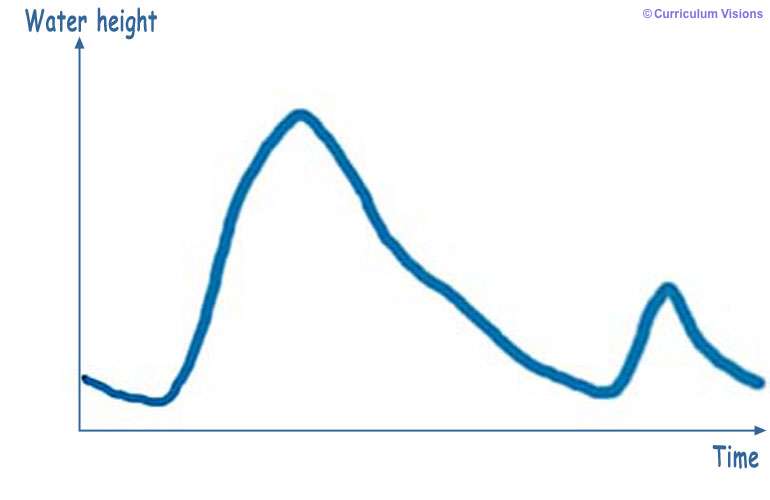
This is the kind of graph you can get if you plot changes in river height with time. The results here would be obtained if you measured a small stream every day for a couple of weeks during a rainy spell. Do not do this during dry weather or the changes will be disappointing. |
|